What's happening in Farnborough.
A quick snapshot of the Farnborough property market.
Across the Southeast, increased housing supply has given buyers more choice. Well-presented homes continue to attract interest, but buyers are taking more time to compare their options before making an offer. Sellers who price realistically from the outset are in the strongest position to attract serious buyers.
£379,349
Average sold price.
-2%
Annual price change.
86 days
Average time to sell.*
£1,559
Average monthly rent.
Data taken from Rightmove Plus
*properties on market excluding those STC.
What’s happening to house prices in Farnborough?
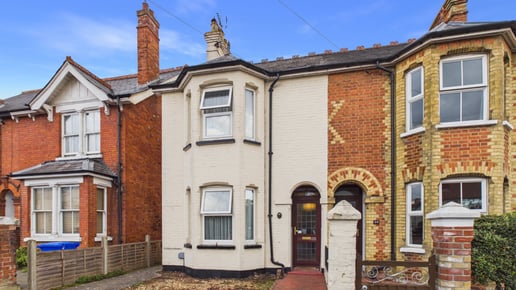
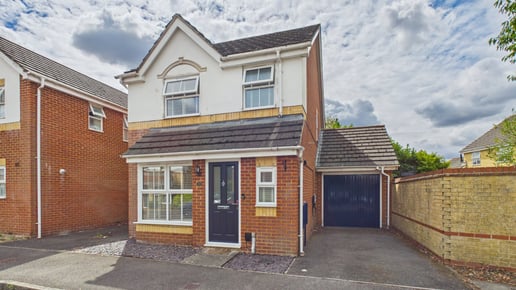
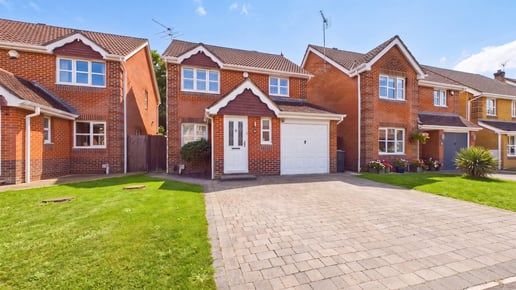
The average sold house price in Farnborough over the last year remained similar to the previous year. Semi-detached properties were the most in-demand, achieving an overall average of £421,613. Detached properties reached £592,801, terraced properties sold for an average of £348,825 while flats fetched £204,007.
Book your free valuationHow does the local market compare?
| Area |
Average property price
Average property price |
Average rental price (PCM)
Average rental price (PCM) |
|---|---|---|
| Farnborough | £379,349 | £1,559 |
| Camberley | £494,201 | £2,006 |
| Fleet | £477,429 | £1,988 |
| Frimley | £477,066 | £1,888 |
Market conditions: Is now a good time to sell?
Mortgage rates peaked at around 5% in April but have since started to ease, helping improve affordability for buyers. (Zoopla House Price Index, 30 June 2026)
The average asking price in the Southeast is £484,819, with homes taking around 65 days to secure a buyer. Nationally, the number of homes for sale is at its highest level for this time of year, giving buyers more choice. If you're thinking of selling, success is less about timing the market and more about presenting your home well and pricing it correctly.
Despite the increase in properties on the market, 2026 is still showing healthy demand compared to last year:
- Average time to sell (properties on market excluding those STC): 86 days. In the last six months of 2025, the average was 94 days.
- Average number of property views on Rightmove: 84.1 daily views per property. In the last six months of 2025, the average was 60.4 views per property.
Book your free valuation in Farnborough.
We've been valuing properties for over 35 years. With live market data and local insight, we'll give an accurate figure for sale or rental properties that reflects the current market.
A quick snapshot of the lettings market:
Farnborough’s average rental price is £1,559pcm, which is a 2% increase over the past 12 months. In the past ten years, rental prices have increased by 34.1%. Properties typically achieve a rental yield between 3.8% and 6.9%.
Across our areas, we're continuing to see strong levels of tenant demand, with well-priced and well-presented homes attracting good-quality applicants and letting quickly. *In the first half of the year, Prospect’s instruction-to-let ratio increased from 91% to 97%, with an average of 8.9 applicants per property.
(HM Land Registry Data)
Our Farnborough property experts.
Darren Winter
Branch PartnerA track record of success since 2011. Darren's won several company awards for great service. Outside work, he still chases wins but with Reading Football Club.
Elliott Garrington
Branch PartnerElliott brings over a decade of experience and a reputation for results. He knows how to match tenants to homes and maximise returns.